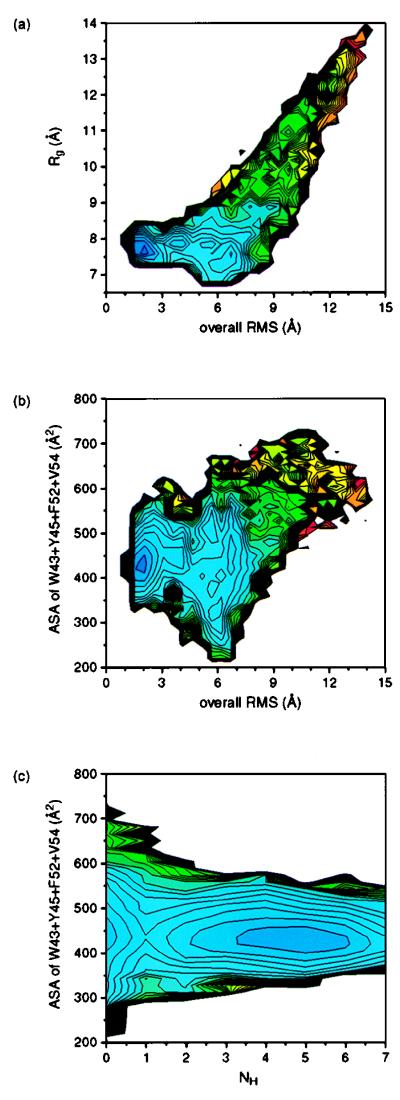
Figure 3.
Two-dimensional projections of the free energy. (a) The free energy as a function of the overall rms deviation from the native structure and the radius of gyration (Rg). (b) The free energy as a function of the overall rms deviation from the native structure and the ASA of the hydrophobic side chains (W43, Y45, F52, and V54); the ASA is measured with a 1.4-Å radius probe. (c) The free energy as a function of the number of native hairpin hydrogen bonds (NH) and the ASA of the hydrophobic side chains; see Fig. 1 for hydrogen bond definitions. The contours are spaced at intervals of 0.5 kcal/mol and range from blue for low (favorable) values to red for high (unfavorable) values; contours more than 15 kcal/mol above the global free energy minimum are not drawn.

