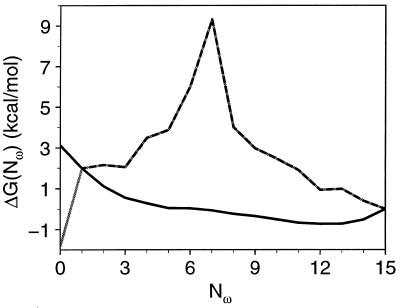
Figure 6.
Free energy as a function of the number of native peptide bonds (Nω). The black solid line is for the total number of native peptide bonds. The dashed line represents the “standard” single sequence approximation (31) and the gray line represents the “modified” single sequence approximation (ref. 17; see text).

