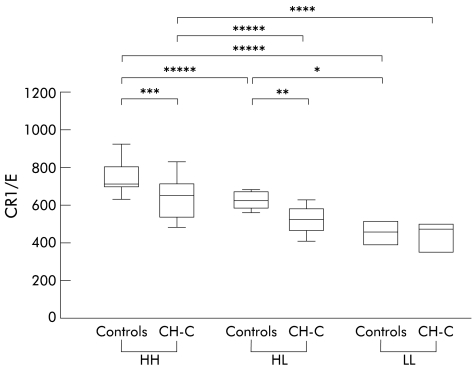
Figure 3.
Comparison of mean number of complement receptors type 1 per erythrocyte (CR1/E) between CR1 gene polymorphisms in controls and chronic hepatitis C (CH-C). Box plots of CR1/E levels for each polymorphism are shown. The boxes and bars are as in fig 1 ▶. Genotypes are indicated at the bottom of the figure: HH, individuals homozygous for the CR1 high density allele; HL, individuals heterozygous for the CR1 gene polymorphism; LL, individuals homozygous for the CR1 low density allele. CR1 gene polymorphism and disease associated differences in CR1/E levels were noted. *p=0.025, **p=0.023, ***p=0.013, ****p=0.010, *****p<0.001.

