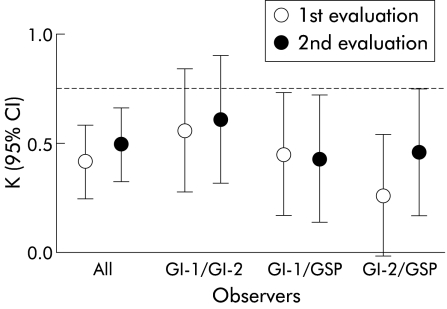
Figure 4.
Graphical representation of kappa coefficients for a diagnosis of high grade dysplasia versus intramucosal adenocarcinoma for all combinations of observers before and after establishment of uniform histological criteria. The broken line represents a kappa coefficient of 0.80. GI-1/GI-2 , gastrointestinal pathologists 1 and 2; GSP, general surgical pathologist; K, kappa coefficient; 95% CI, 95% confidence interval.

