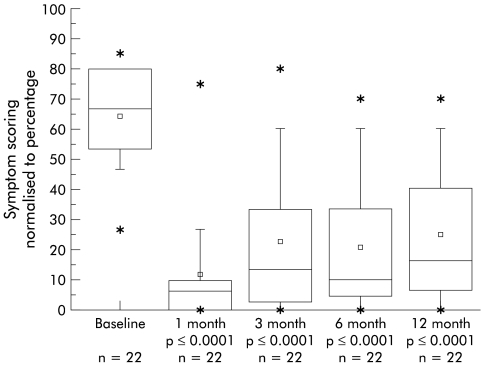
Figure 1.
Symptom scoring of the patient data set, normalised to percentage, before (baseline) and one, three, six, and 12 months post procedure, where a maximum symptom score of 30 is represented as 100%. The horizontal lines of the box denote the 25th, 50th, and 75th percentile values, where the 50th percentile is the median of the range of the data. The square symbol in the box denotes the mean. Error bars denote the 5th and 95th percentiles and asterisks the 0 and 100th percentiles.

