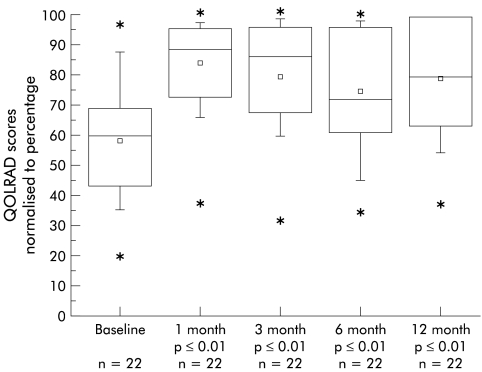
Figure 3.
Combined results of the five parameters of quality of life (QOL) assessment before (baseline) and one, three, six, and 12 months post procedure. Data are normalised to percentage where a maximum symptom score of 175 (that is, normality) is represented as 100%. Boxes and symbols as for fig 1 ▶.

