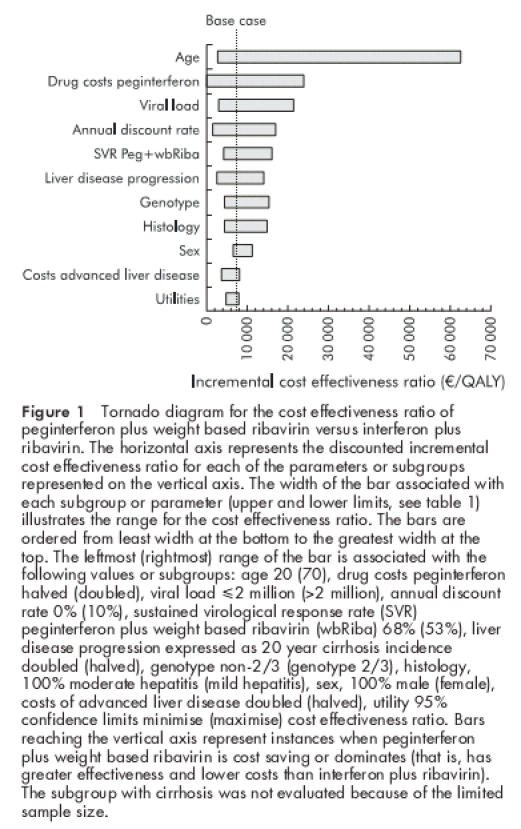
Figure 1.

Tornado diagram for the cost effectiveness ratio of peginterferon plus weight based ribavirin versus interferon plus ribavirin. The horizontal axis represents the discounted incremental cost effectiveness ratio for each of the parameters or subgroups represented on the vertical axis. The width of the bar associated with each subgroup or parameter (upper and lower limits, see table 1 ▶) illustrates the range for the cost effectiveness ratio. The bars are ordered from least width at the bottom to the greatest width at the top. The leftmost (rightmost) range of the bar is associated with the following values or subgroups: age 20 (70), drug costs peginterferon halved (doubled), viral load ≤2 million (>2 million), annual discount rate 0% (10%), sustained virological response rate (SVR) peginterferon plus weight based ribavirin (wbRiba) 68% (53%), liver disease progression expressed as 20 year cirrhosis incidence doubled (halved), genotype non-2/3 (genotype 2/3), histology, 100% moderate hepatitis (mild hepatitis), sex, 100% male (female), costs of advanced liver disease doubled (halved), utility 95% confidence limits minimise (maximise) cost effectiveness ratio. Bars reaching the vertical axis represent instances when peginterferon plus weight based ribavirin is cost saving or dominates (that is, has greater effectiveness and lower costs than interferon plus ribavirin). The subgroup with cirrhosis was not evaluated because of the limited sample size.
