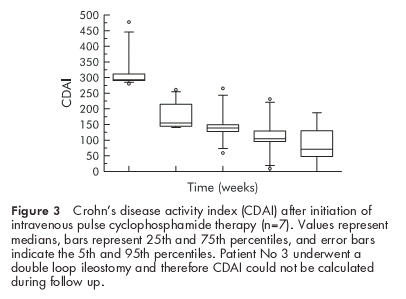
Figure 3.

Crohn’s disease activity index (CDAI) after initiation of intravenous pulse cyclophosphamide therapy (n=7). Values represent medians, bars represent 25th and 75th percentiles, and error bars indicate the 5th and 95th percentiles. Patient No 3 underwent a double loop ileostomy and therefore CDAI could not be calculated during follow up.
