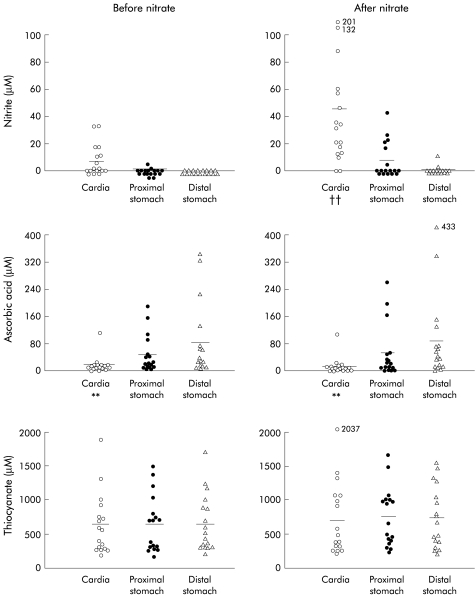
Figure 3.
Concentrations of nitrite, ascorbic acid, and thiocyanate in the stomach before and after a nitrate meal. The after nitrate sample was collected over the 40 minute period starting 40 minutes after nitrate administration. The horizontal lines represent mean concentrations. Outliers are indicated with values next to the symbols. Statistically significant differences are indicated: for nitrite, ††p<0.01 compared with the cardia before nitrate administration and compared with the proximal and distal stomach after nitrate; for ascorbic acid, **p<0.01 compared with the proximal and distal stomach both before and following nitrate.

