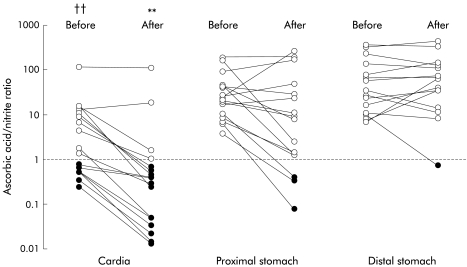
Figure 4.
Ratio of ascorbic acid to nitrite in the different regions of the stomach before and after nitrate, using a logarithmic scale. The after nitrate sample was collected over the 40 minute period starting 40 minutes after nitrate administration. ††p<0.01 compared than the proximal and distal stomach before nitrate; **p<0.02 compared with the cardia before nitrate, and compared with the proximal and distal stomach after nitrate (p<0.01).

