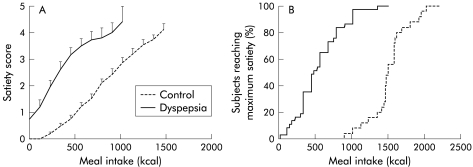
Figure 1.
(A) Satiety scores during the satiety drinking test in healthy controls (n=25) and in patients with functional dyspepsia (n=37). With increasing amounts of calories ingested, increasing satiety scores were generated. In patients, satiety scores were significantly higher compared with healthy subjects (ANOVA, p<0.001). Data are shown until the first data point reached by less than half of the subjects. (B) Cumulative percentage of subjects reaching maximum satiety (satiety score 5) during the satiety drinking test in healthy controls and patients with functional dyspepsia.

