Figure 3.
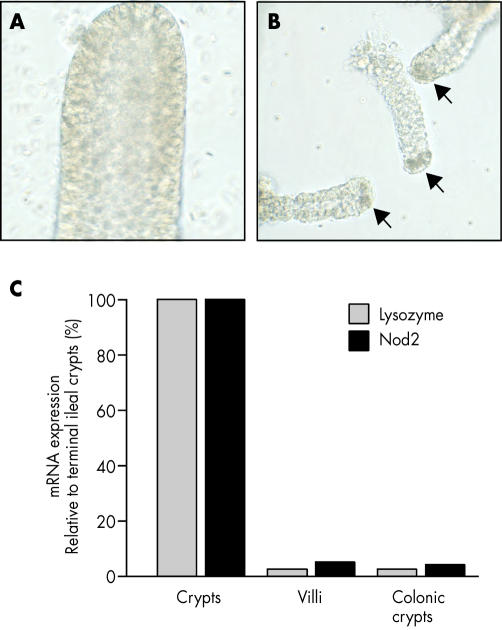
Expression of NOD2 mRNA in crypt and villus epithelial cells. (A) Whole villi and (B) crypts containing Paneth cells (arrows) were obtained by calcium chelation and mechanical shaking of mucosal tissue dissected from surgically resected small intestinal segments, and viewed under the 20× objective in an inverted phase microscope. (C) Quantitative real time reverse transcription-polymerase chain reaction (RT-PCR) analysis of crypt and villus epithelium shows enrichment of lysozyme and NOD2 mRNA expression in crypts. Lysozyme is approximately 40-fold enriched in crypts and NOD2 approximately 20-fold enriched in crypts from the terminal ileum compared with villi or colonic crypts. Relative expression of NOD2 and lysozyme mRNA was determined by real time RT-PCR, using intron spanning primers, and NOD2:glyceraldehyde-3-phosphate dehydrogenase (GAPDH) and lysozyme:GAPDH ratios, calculated for each sample. Results are shown as relative expression compared with the level in small intestinal crypts.

