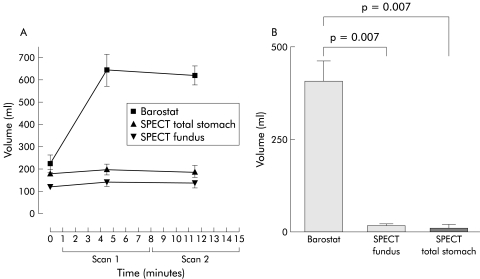
Figure 5.
(A) Volumes measured before and after glucagon intravenous injection, as assessed by barostat and single photon emission computed tomography (SPECT). Scan 1 was performed from one up to eight minutes, followed by scan 2 from eight to 15 minutes. (B) Glucagon induced fundic accommodation measured by barostat and SPECT was significantly different (p<0.05, Student’s t test).

