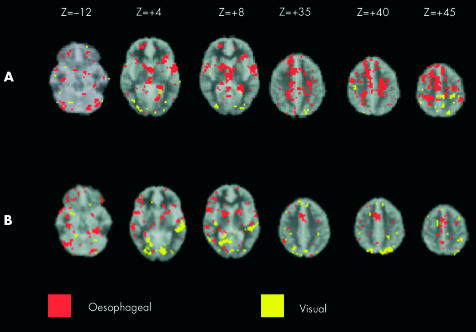
Figure 2.
(A) Comparison of brain activation between selective attention to visual (yellow) and selective attention to oesophageal (red) stimuli. Images run inferior to superior (left to right). (B) Comparison of brain activation between divided attention to visual (yellow) and divided attention to oesophageal stimuli (red). Images run inferior to superior (top left to bottom right). Stereotactic (z) coordinate is shown across the top of the figure. Note: the comparisons of oesophageal v visual targets in both selective and divided attention experiments were generated from the product of the target stimuli of sensory modality 1 (for example, visual) subtracted from a standardised rest condition (that is generated from interstimulus intervals) being compared to the product of target stimuli of sensory modality 2 (for example, visceral) subtracted from a standardised rest condition.

