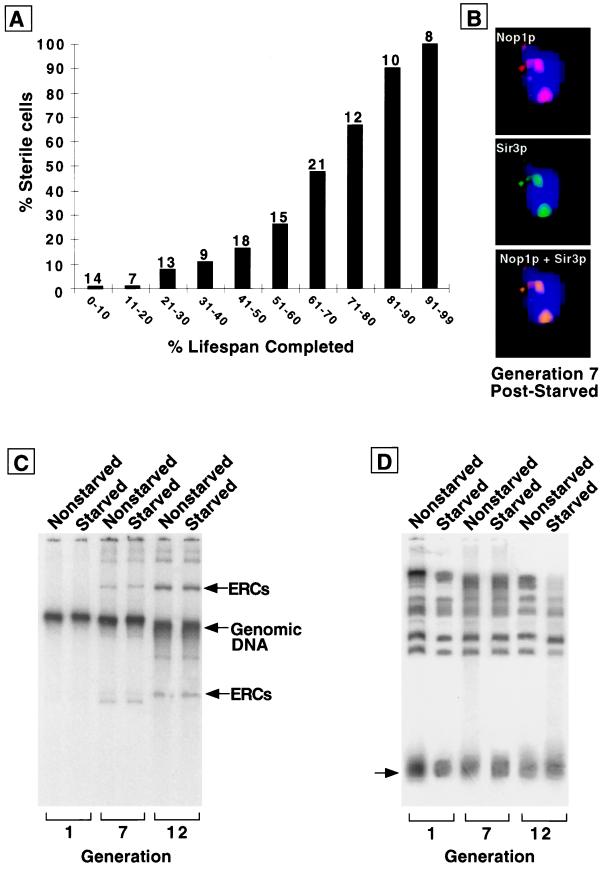
Figure 4.
The reduced lifespan of cells with prior stationary phase experience is accompanied by sterility and nucleolar changes but not more rapid ERC accumulation. (A) Sterility assay performed on cells maintained for 3 weeks in stationary phase before plating on YPD. The numbers above each bar represent the number of cells whose response to pheromone was scored at this point of their lifespan. (B) Multilabel immunohistochemical study of a typical cell from a population analyzed in A. Cells with an average generation of seven were obtained by sorting (average bud scar count = 7.2 ± 3.1). Sir3p colocalizes to nucleolar fragments. (C) ERC levels measured in nonstarved and starved cells. Starved cells are cells that have experienced 3 weeks in stationary phase before reexposure to fresh YPD. Nonstarved cells are cells obtained from logarithmic-phase cultures that have never been through stationary phase. Average bud scar count in the sorted starved populations labeled generations 1, 7, and 12 = 0.9 ± 1.1, 6.8 ± 2.6, and 12.4 ± 4.1, respectively; average bud scar count in the corresponding nonstarved populations = 0.9 ± 1.1, 7.4 ± 3.1, and 11.7 ± 3.8. The fractional representation of ERCs in each of the total cellular DNA preparations shown was defined by comparing signals from the ERC bands with signals from all bands by using a PhosphorImaging system. Fractional representation of ERCs for both nonstarved cells and starved cells are <1% at generation 1 and 23% at generation 7. At generation 12, the values are 32 and 33%, respectively. (D) Telomere length does not change appreciably as nonstarved and starved cells age. The same DNA preparations used in C were digested with XhoI. Southern blots were prepared and probed with a 600-bp fragment corresponding to the conserved Y′ region of yeast telomeres. The arrow points to a broad band, migrating at ≈1 kilobase, consisting of Y′ telomeres.

