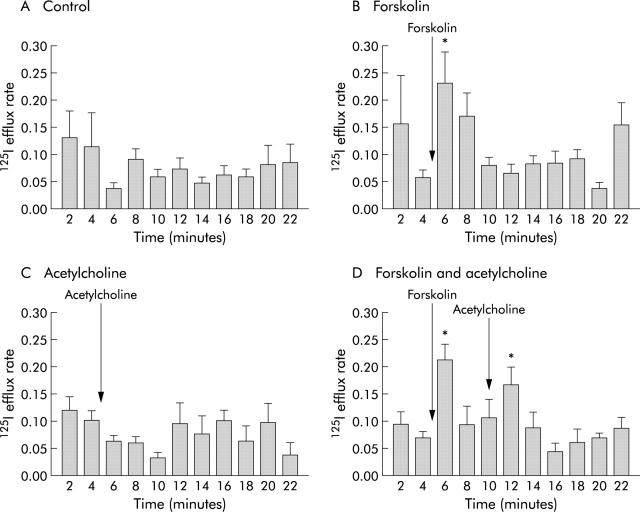
Figure 3.
Effect of forskolin (B), acetylcholine alone (C), and acetylcholine in the presence of forskolin (D) on efflux of 125I from T84 cells. Acetylcholine (50 μM) was given five minutes after forskolin (10 μM) to the basolateral surface. The Y axis values are efflux rate constants (r/min). *p<0.05 compared with time matched controls (A). Data are means (SEM) (n = 6).

