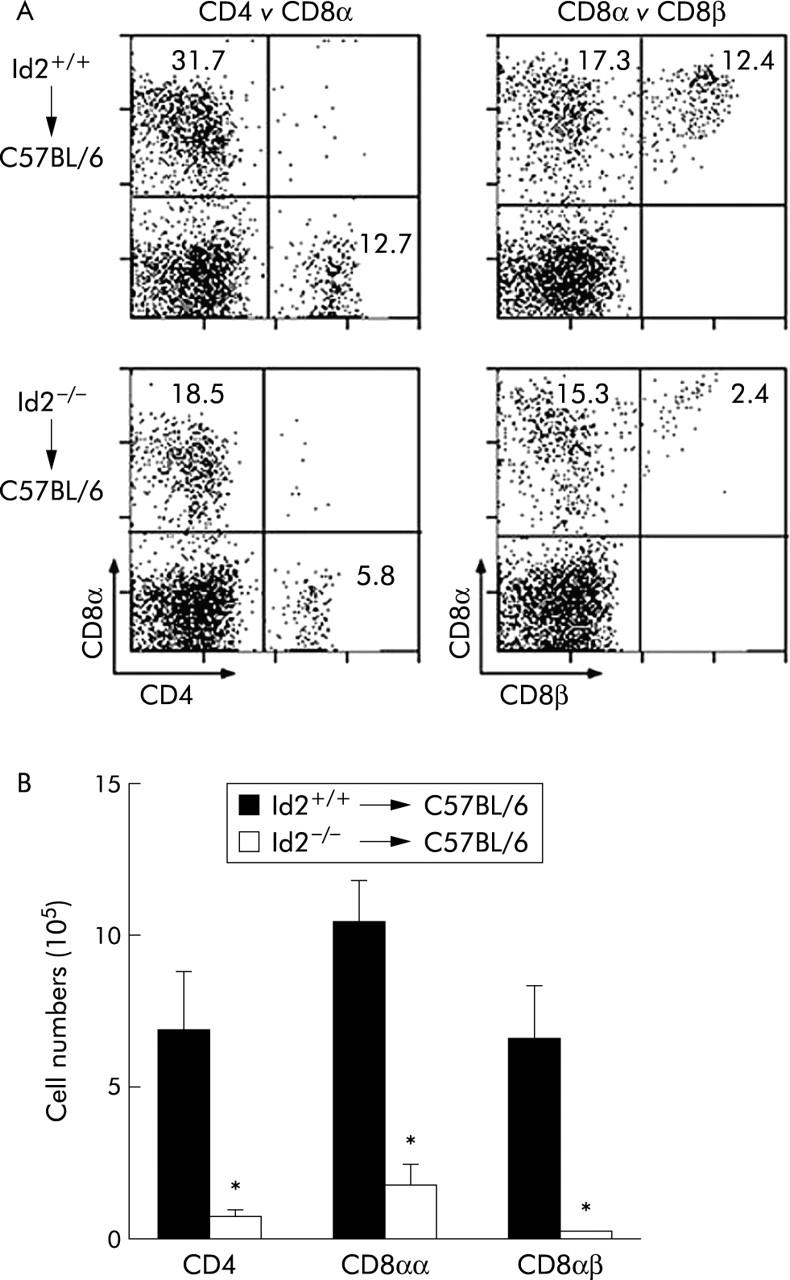
Figure 3.

Phenotypic analysis of intestinal intraepithelial lymphocytes (IELs) after bone marrow transplantation. (A) Flow cytometric analysis of IELs of C57BL/6 mice (Ly 9.2) mice that were reconstituted with bone marrow cells of Id2+/+ or Id2−/− mice (Ly 9.1). IELs of donor origin were analysed for cell surface marker expression, as indicated by gating Ly 9.1+ cells. Percentages of cells with a given phenotype are shown. Representative data of four mice per group are shown. (B) Absolute number of each subset was obtained by multiplying the percentage of each subpopulation by the total number of viable cells. Results are expressed as mean (SEM) number. Each number represents the mean of four animals per group. *p<0.05, as determined by the Student’s two tailed t test.
