
Figure 4.
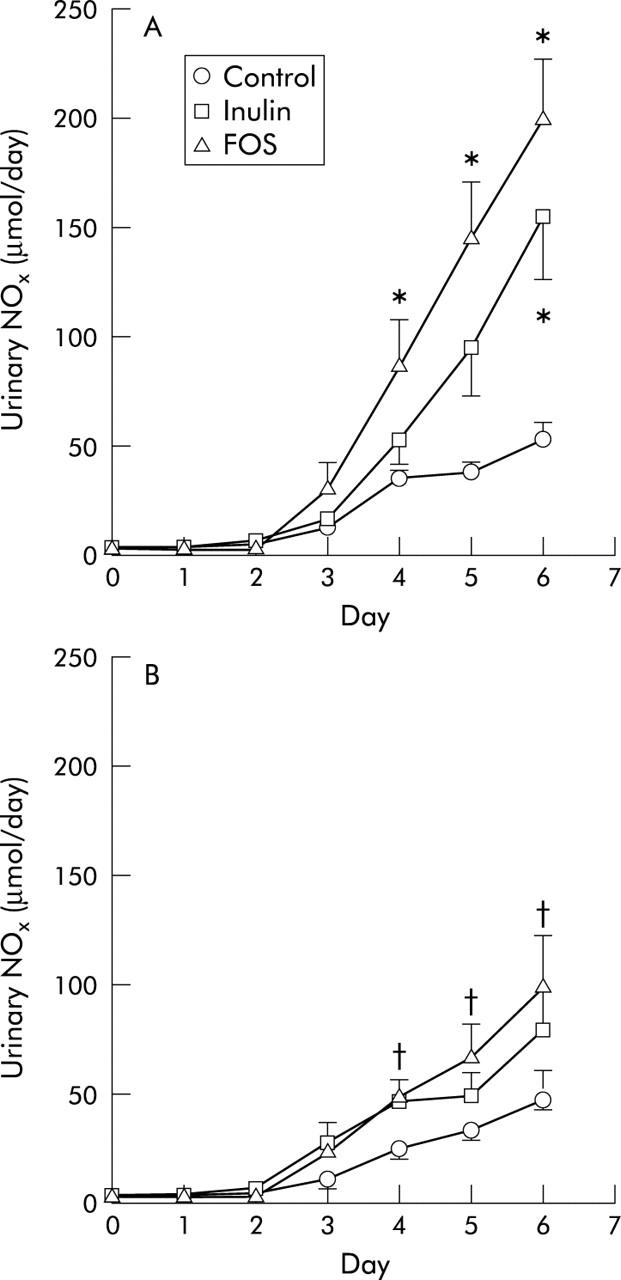
Urinary sum of nitrate and nitrite (NOx) excretion in the control, inulin, and fructo-oligosaccharide (FOS) groups after an oral challenge with 2×10⁹ colony forming units of Salmonella enterica serovar Enteritidis on day 0 in the (A) low calcium groups and (B) high calcium groups. Results are expressed as mean (SEM) (n = 7 in the high calcium FOS group and n = 8 in the other diet groups). *Significantly different from the low calcium/control group at that time point (p<0.05); †significantly different from its low calcium counterpart at that time point (p<0.05).