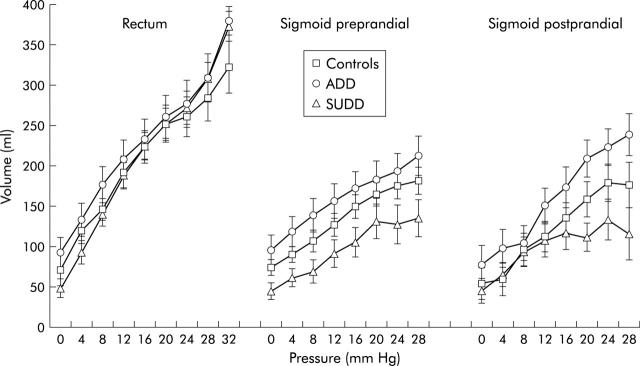
Figure 3.
Volume-pressure curves in the rectum and sigmoid colon during the preprandial period and in the sigmoid colon in the postprandial period on isobaric distensions in healthy controls, asymptomatic diverticular disease (ADD) patients, and symptomatic uncomplicated diverticular disease (SUDD) patients. Preprandially, the SUDD curve was shifted downwards compared with the ADD curve (*p = 0.026).

