
Figure 6.
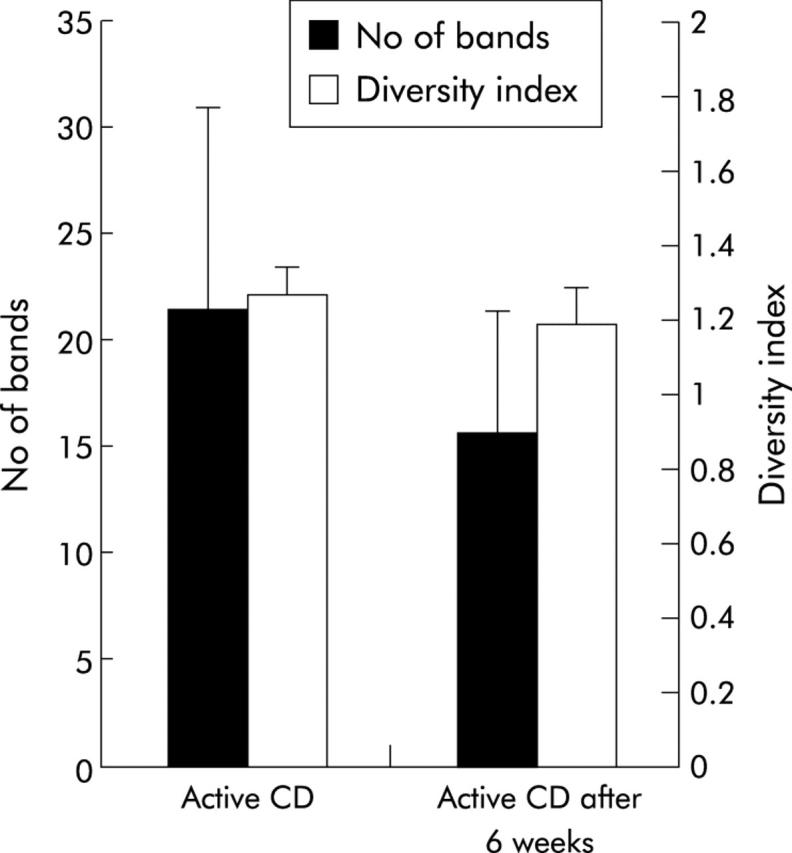
Comparison of the bacterial profiles of 10 patients with active Crohn’s disease (CD) before and after a six week follow up. Bacterial diversity is indicated as number of bands (SD) and as diversity score (SD). Biodiversity was lower after six weeks but the results were not significant (p = 0.054).