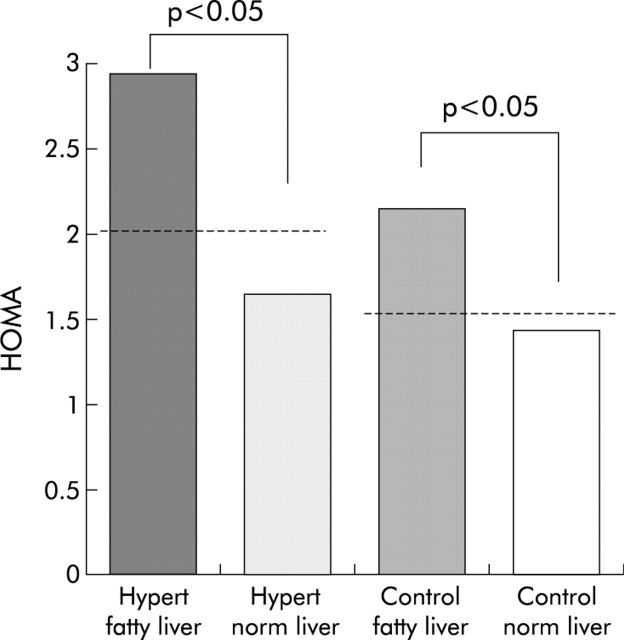
Figure 1.
Homeostasis model assessment index (HOMA), an indicator of insulin resistance. Values are mean (SD) in hypertensive (Hypert) patients and control subjects subgrouped according to presence or absence of fatty liver. p values indicate significance level of differences between subjects with and without fatty liver in hypertensive patients and in controls, as calculated using the unpaired t test.

