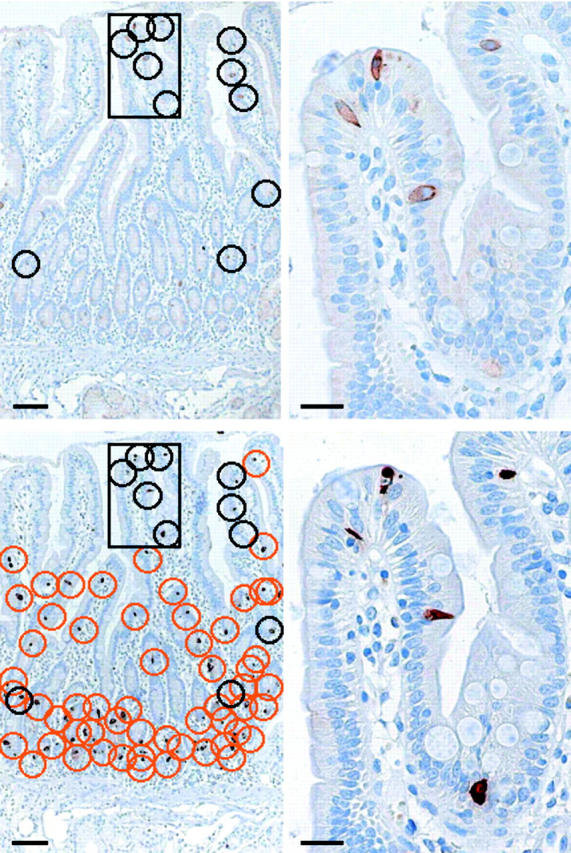
Figure 3.

Representative data for somatostatin receptor 2A (sst2A) and chromograninA (CgA) immunohistochemistry on serial sections of the duodenum. Bars 100 μm. Insets on the right represent enlarged views of the framed areas (bars 25 μm). First row: Sst2A immunohistochemistry; second row: CgA immunohistochemistry. Stained epithelial cells were encircled black or orange. Black circles denote individual sst2A cells that were also stained for CgA on the serial section in the second row. In this example, all sst2A cells were identified as CgA positive. For comparison, orange circles identified CgA positive cells that were not sst2A positive. Sst2A cells were heterogeneously distributed and often situated in villi. Tall and flask-like cells revealed mainly membranous sst2A and cytoplasmic CgA staining.
