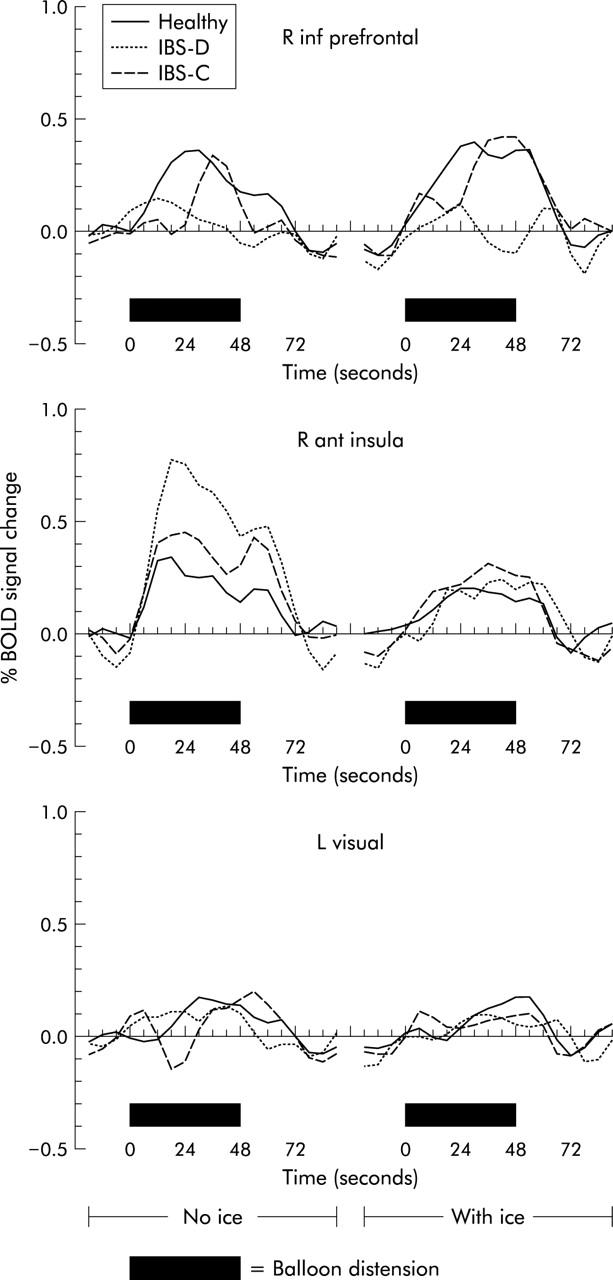
Figure 4.

Averaged functional magnetic resonance imaging time courses (BOLD signal change) for right inferior prefrontal (R inf prefrontal) volumes of interest, right anterior insula (R ant insula), and the left visual cortex (L visual, control region) in healthy controls, and constipated (IBS-C) and diarrhoeic (IBS-D) irritable bowel syndrome (IBS) patients. Black bars mark balloon inflation. Responses to rectal balloon inflation without (left graph) and with (right graph) heterotopic stimulation are shown. Note delay of BOLD responses due to both haemodynamic delay and time needed to inflate/deflate the balloon.
