
Figure 5.
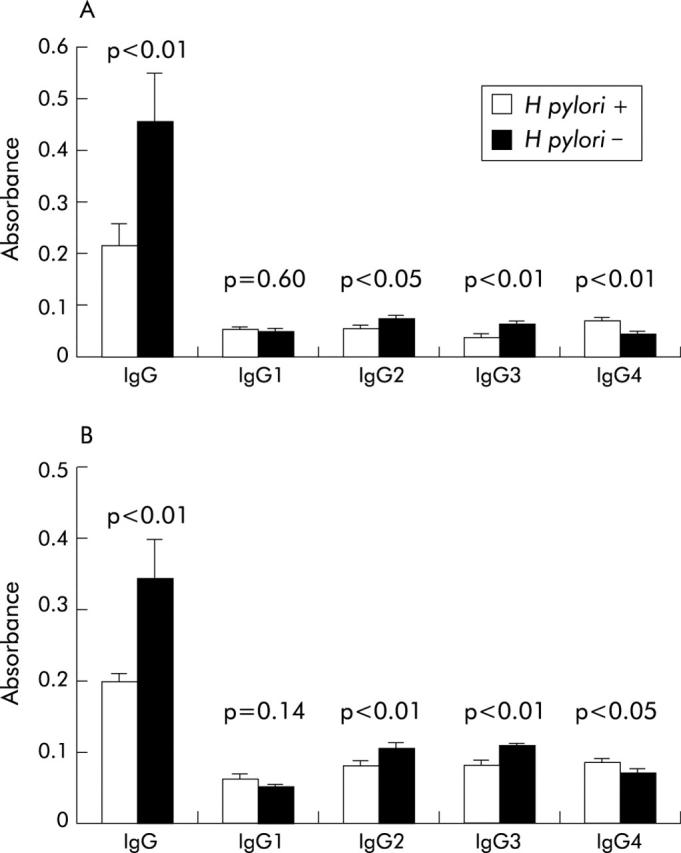
Total IgG and IgG subclass responses to neutrophil activating protein (NapA) and alkyl hydroperoxide reductase (AphC). Total IgG response and the various IgG subclass responses to NapA (A) and AphC (B) in serum obtained from Helicobacter pylori positive and H pylori negative individuals are shown. IgG levels were determined by ELISA, as described in the methods section and the absorbance axes represent readings obtained at 450 nm for total IgG and 405 nm for the IgG subclasses.