
Figure 10.
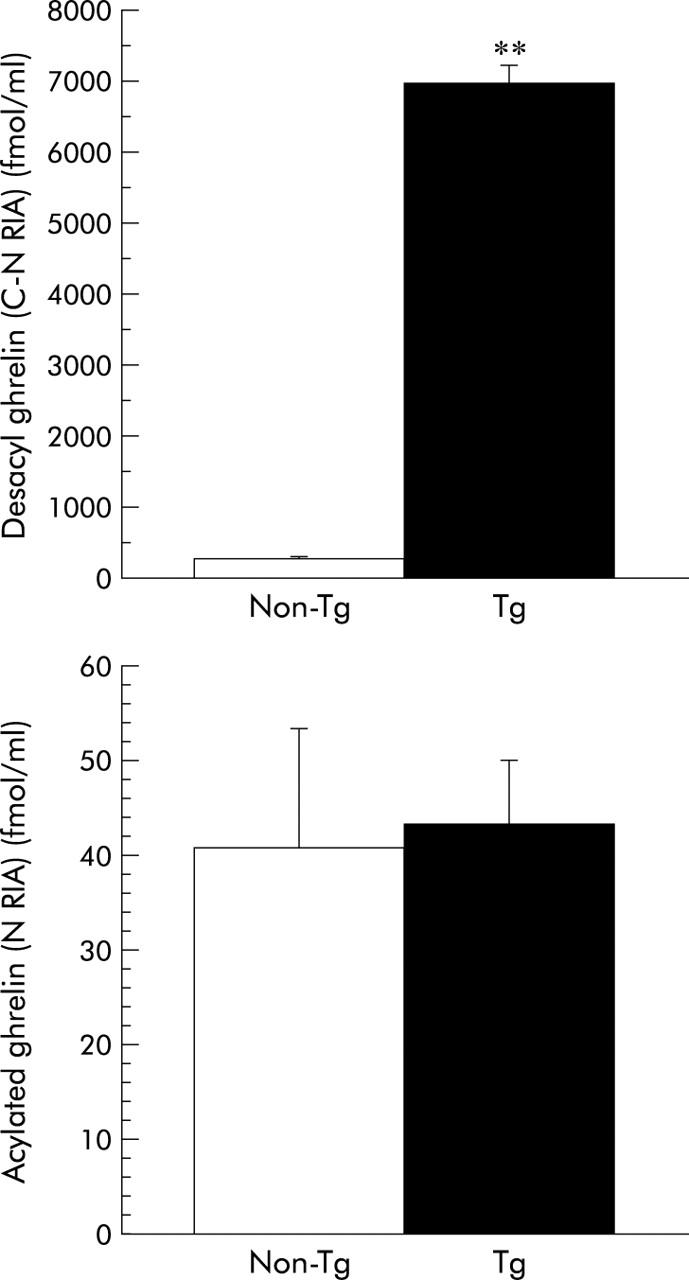
Plasma ghrelin concentrations in Tg mice and non-Tg littermates. Results are expressed as mean (SEM) (n = 3). **p<0.01 compared with the non-Tg littermates by Bonferroni’s t test. This experiment was repeated in another line (11–1) of Tg mice, with similar results.