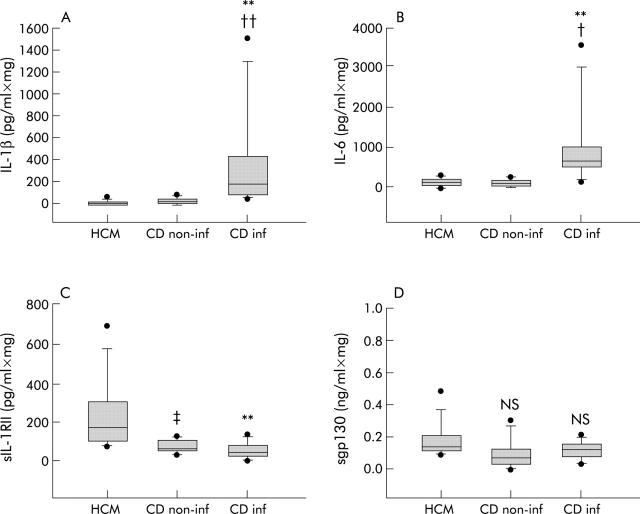
Figure 4.
Interleukin 1β (IL-1β) (A), IL-6 (B), soluble interleukin 1 receptor II (sIL-1RII) (C), and sgp130 (D) levels in 18 hour culture media of colonic biopsies of healthy (HCM, n = 8), non-inflamed Crohn’s disease (CDnon-inf, n = 7), and inflamed Crohn’s disease mucosa (CDinf, n = 8). CDinf v HCM: **p<0.01; CDinf v CDnon-inf: †p<0.05, ††p<0.01; CDnon-inf v HCM: ‡p<0.05. Results are shown as box plots; the line within the box represents the median value with the outer limits of the box representing the 25th and 75th percentile values; whiskers above and below the box indicate the 90th and 10th percentile values. Statistical comparisons were performed using the Kruskal-Wallis test.

