
Figure 3.
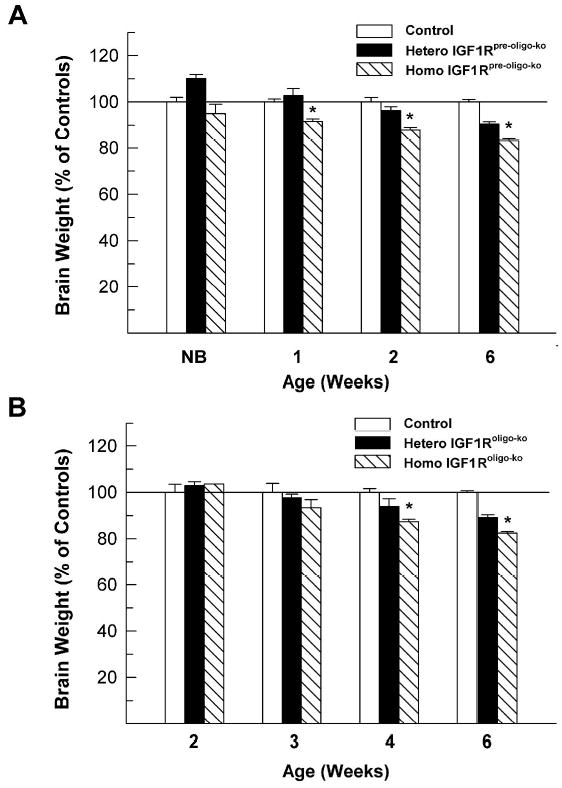
Brain weights of IGF1Rpre-oligo-ko (panel A) and IGF1Roligo-ko (panel B) mutant mice during development. Brain weight is expressed as percentage of controls, and values are means ± SE from 6 -10 mice. A line is drawn at 100% to facilitate comparison. NB = newborn. *, P < 0.01, compared to WT.