
Figure 6.
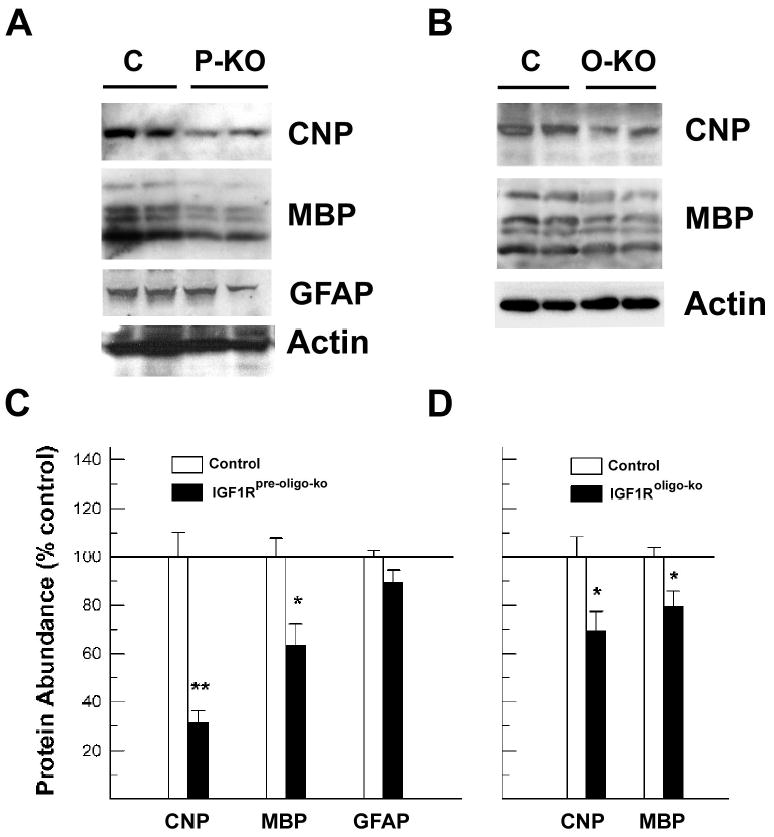
Western immunoblot analysis of CNP, MBP and GFAP in the cerebral cortex of IGF1Rpre-oligo-ko and IGF1Roligo-ko mice. Panel A. Representative Western immunoblot of CNP, MBP and GFAP protein in 2-week-old IGF1Rpre-oligo-ko (P-KO) mice and controls (C). Panel B. Representative Western immunoblot of CNP and MBP protein in 6-week-old IGF1Roligo-ko (O-KO) mice and littermate controls (C). Panel C. Quantitative analysis of CNP, MBP and GFAP protein abundance in 2-week-old IGF1Rpre-oligo-ko mice. Panel D. Quantitative analysis of CNP and MBP protein abundance in 6-week-old IGF1Roligo-ko mice. The protein abundance is expressed as percentage of that in controls, and values are mean ± SE of 3 –5 samples. A line is drawn at 100% to facilitate comparison. *, P < 0.05; **, P < 0.01, compared to controls.