
Figure 8.
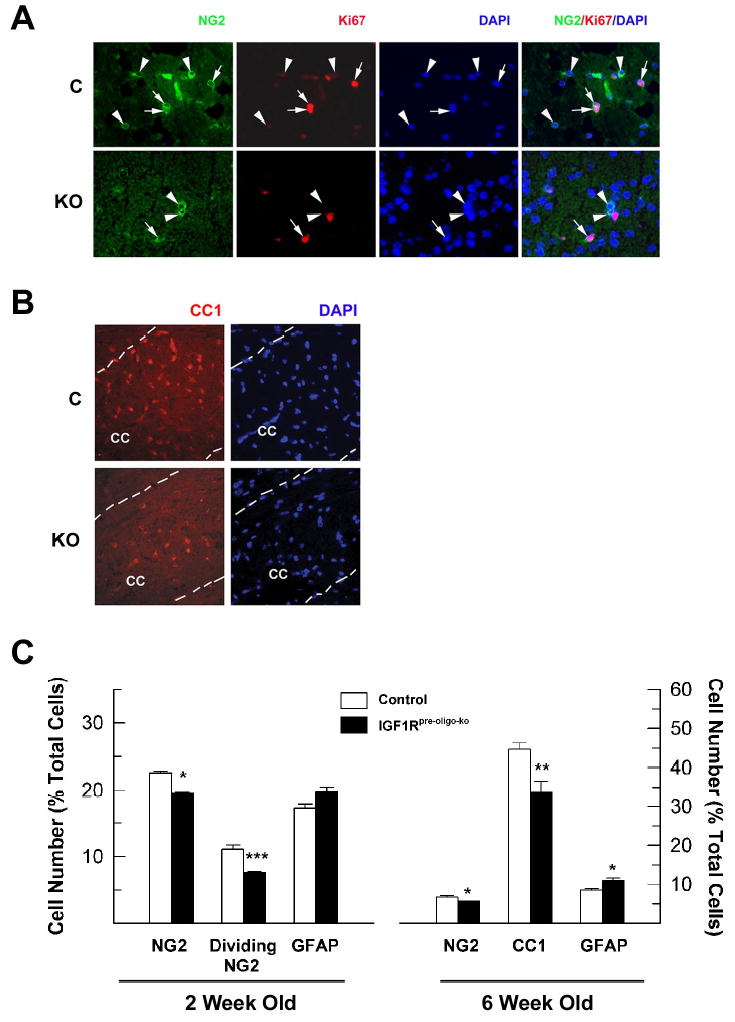
The number of NG2+ oligodendrocyte precursors, CC1+ oligodendrocytes and GFAP+ astrocytes in the CC of IGF1Rpre-oligo-ko mutant (KO) and their littermate controls (C). Panel A. Representative photomicrographs of double NG2 and Ki67 immunostaining from a 2-week-old IGF1Rpre-oligo-ko and a control mouse. Arrowheads indicate NG2+ precursors, and arrows point to cells positive for both NG2 and Ki67. Photomicrographs of merged NG2, Ki67, and DAPI images are shown in the right column. NG2 and Ki67 double-labeled cells are more numerous in the control brain. Panel B. Representative photomicrographs of CC1 immunostaining of CC from a 6-week-old IGF1Rpre-oligo-ko mutant mouse and a littermate control mouse. Dotted lines outline the CC. Panel C. Quantification of NG2+, proliferating NG2+, CC1+ and GFAP+ cells in the CC of IGF1Rpre-oligo-ko mice at 2 and 6 weeks of age. Values represent mean ± SE of 3 – 4 mice from each group. *, P < 0.05; **, P < 0.02; ***, P < 0.01; compared to controls.