
Figure 9.
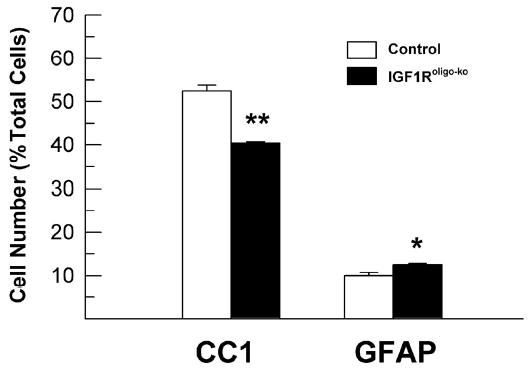
The number of CC1+ and GFAP+ cells in the CC of IGF1Roligo-ko mice at 25 weeks of age. Values represent mean ± SE of 3 - 4 mice from each group. *, P < 0.05; **, P < 0.001, compared to controls.
Official websites use .gov
A
.gov website belongs to an official
government organization in the United States.
Secure .gov websites use HTTPS
A lock (
) or https:// means you've safely
connected to the .gov website. Share sensitive
information only on official, secure websites.
The number of CC1+ and GFAP+ cells in the CC of IGF1Roligo-ko mice at 25 weeks of age. Values represent mean ± SE of 3 - 4 mice from each group. *, P < 0.05; **, P < 0.001, compared to controls.