
Figure 3.
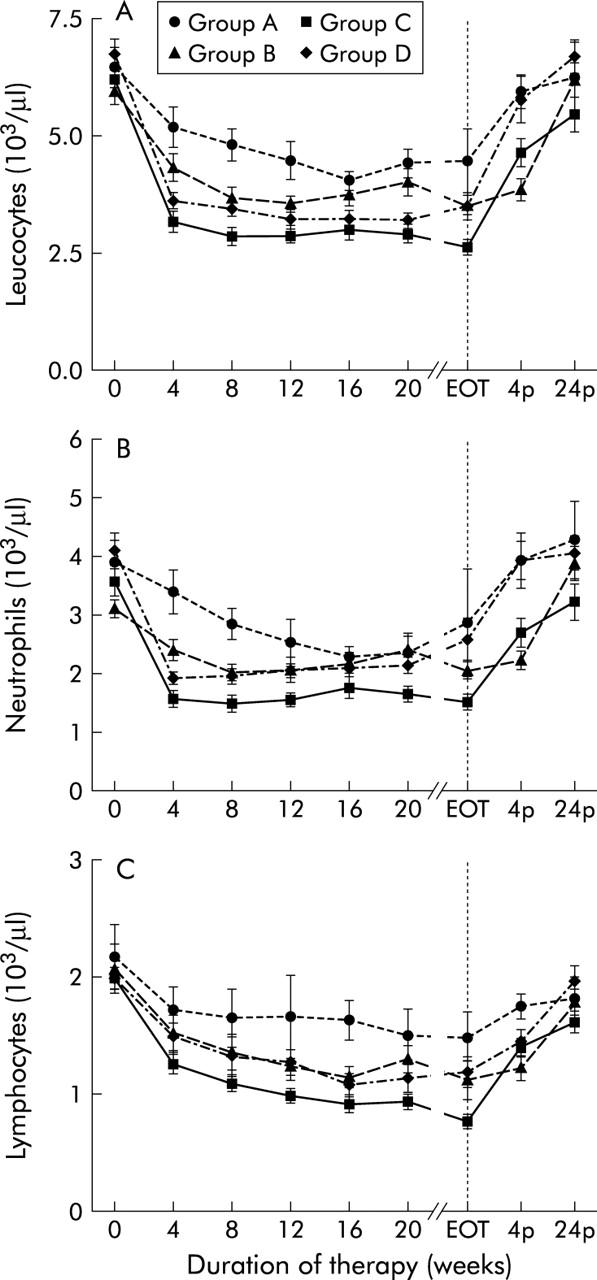
Leucopoiesis. Leucocyte count (A), neutrophil count (B), and lymphocyte count (C) before (week 0), during (week 4 until the end of therapy (EOT)) and after (week 4p and week 24p) therapy with conventional interferon α (IFN-α) alone (group A), in combination with ribavirin (group B), with pegylated IFN-α2a (group C), or with pegylated IFN-α2b in combination with ribavirin (group D). Data are mean (SEM).