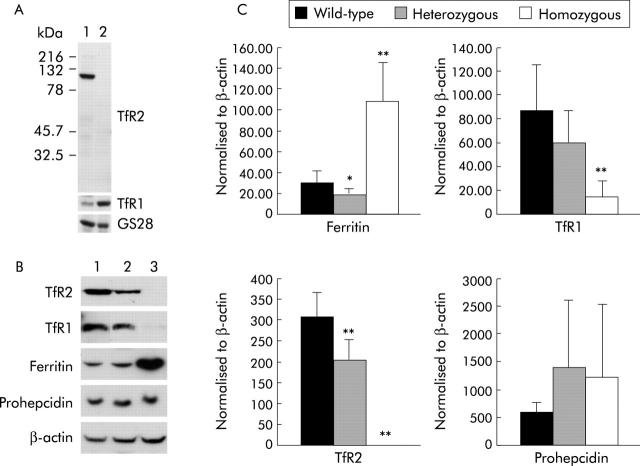
Figure 3.
Quantification of hepatic protein levels. (A) Western blot analysis of 100 μg of mouse liver (lane 1) and kidney (lane 2) homogenates with antibodies against transferrin receptor 2 (TfR2), transferrin receptor 1 (TfR1), and the Golgi marker GS28 as a loading control. Antibodies were specific for TfR2. (B) Total liver protein from 10 week old mice was western blotted with antibodies against TfR2, TfR1, ferritin, prohepcidin, and β-actin. Representative western blot of three mice: lane 1, wild-type; lane 2, heterozygous; lane 3, homozygous TfR2-knockout (KO). (C) Quantification of protein levels after normalising to β-actin. Mean (SD) values are shown for wild-type, heterozygous, and homozygous TfR2-KO mice. *p<0.05; **p<0.01.

