Figure 1.

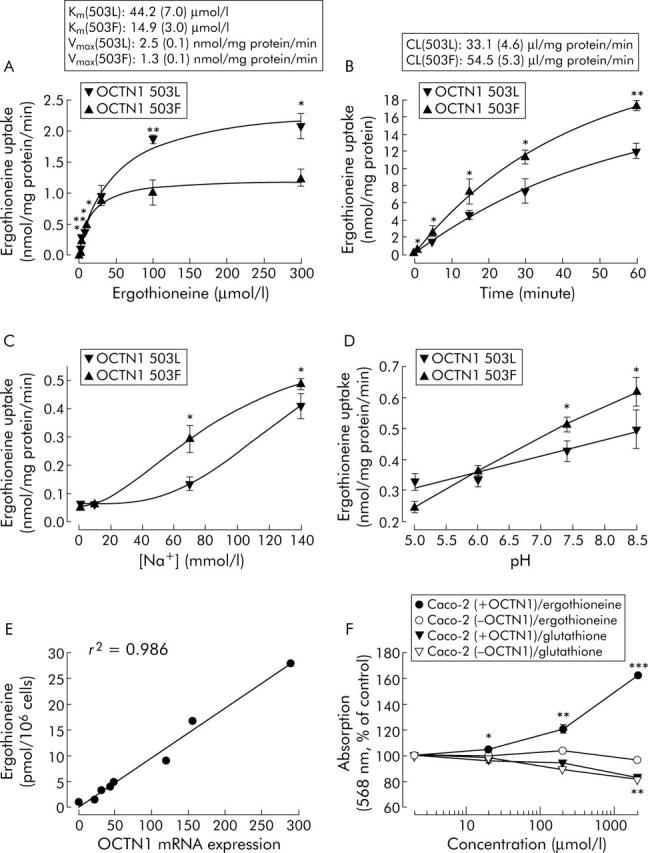
Ergothioneine and OCTN1. Concentration dependence, Km, and Vmax of specific ergothioneine (ET) uptake in HEK293 cells constitutively expressing the 503L variant or the 503F variant after one minute of loading (A); specific uptake and clearance (CL) over a time course after incubation with 10 µmol/l ET (B); effects of sodium (C) and pH (D) on specific uptake after one minute of loading with 10 µmol/l ET. In sodium reduced transport buffer, NaCl was isotonically replaced with choline chloride (which did not interfere with ET transport). An equal expression level of both OCTN1 mRNAs was controlled by quantitative real time polymerase chain reaction (TaqMan assay). Linear correlation of ET concentrations in CD14+ monocytes (fractionated from peripheral blood mononuclear cells by immunomagnetic beads) with OCTN1 mRNA expression (relative to the housekeeping gene GAPDH, lowest expression was set to 1) in eight healthy volunteers that were homozygous carriers of the 503L variant (E). MTT assay10 of the proliferation of Caco-2 colon tumour cells with and without OCTN1 mRNA expression after 24 hours of incubation with ET or glutathione. Resulting formazan formation was determined by absorbance at 568 nm (F). Data are means (SEM) of three (A–D) or 8–16 (F) independent experiments. *p<0.05, **p<0.01, ***p<0.001: significant differences between OCTN1 variants (A–D); significant differences compared with buffer controls (F), as determined by one way ANOVA with Holm-Sidak correction (α = 0.05).
