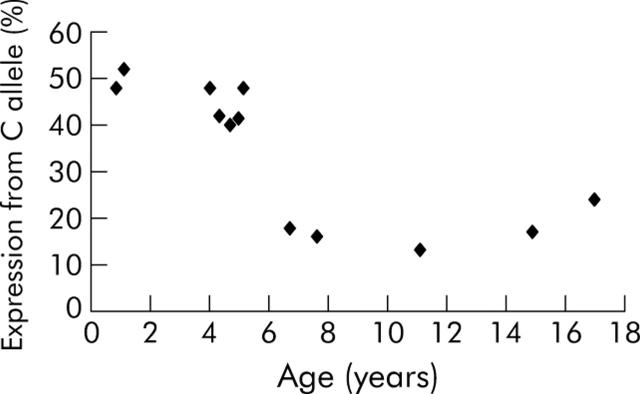
Figure 1.
Relation of age to relative expression of lactase LCT mRNA from the C−13910 compared with that from the T−13910 allele. Actual relative expression of the C allele in the biopsy sample was obtained by relating the results of the minisequencing to an 11 point standard curve (y = 0.0135× − 0.9714 up to 82%; y = 1×10⁻⁵e0.1129x for 82–100%) obtained based on information of the relative amounts of G and A in a G/A+593 heterozygous genomic DNA sample (for details of methods, see Kuokkanen et al3).

