
Figure 2.
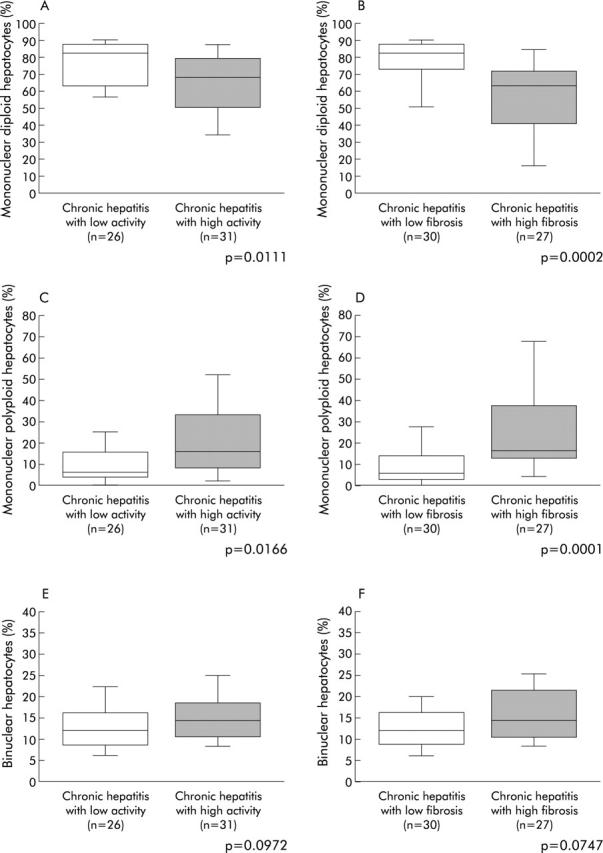
Ploidy/binuclearity distributions, according to the progression of chronic hepatitis. (A, B) Fraction of mononuclear diploid hepatocyte; (C, D) fraction of mononuclear polyploid hepatocytes; and (E, F) fraction of binuclear hepatocytes. (A, C, E) Comparison between low and high activity of inflammation; and (B, D, F) comparison between low and high degrees of fibrosis. Box plots for the percentage of hepatocytes in each population (mononuclear diploid hepatocytes, mononuclear polyploid hepatocytes, and binuclear hepatocytes) out of the total number of hepatocytes analysed. The ends of each box represent the quartiles, and the median of distribution is indicated by a line within the box; n corresponds to the number of patients in each group. All p values were calculated using the Mann-Whitney U test.