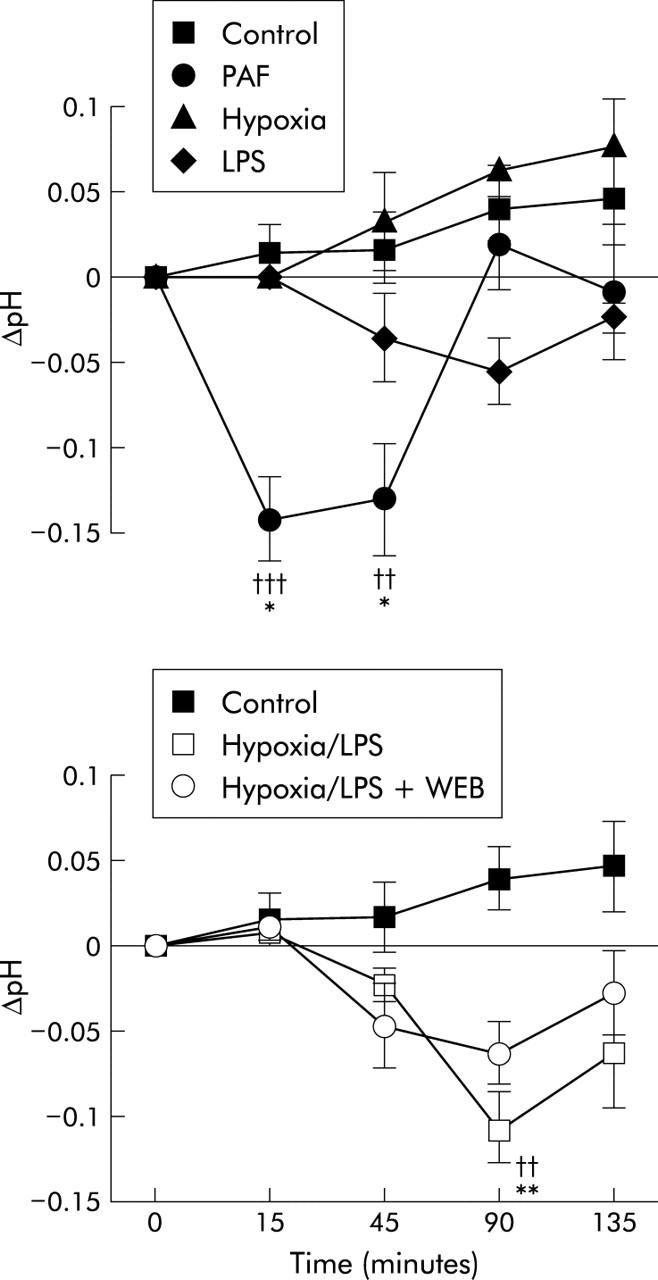
Figure 2.

Change in arterial pH for all study groups. Significant difference between the value recorded and the control group: ††p<0.01, †††p<0.001. Significant difference between the value recorded and the baseline value for that group: *p<0.05, **p<0.01, ***p<0.001. PAF, platelet activating factor; LPS, lipopolysaccharide; WEB, WEB 2170.
