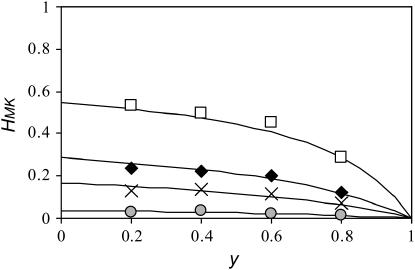
Figure 4.—
Predicted heterozygosity (lines) derived from Equation 7 and corresponding simulation results (symbols), depending on the prevalence of the male-killer infection. In the simulations, we initiated the population with one allele fixed and took values of heterozygosity every 1000 generations. Each datum is an average of 300 values of heterozygosity. In all simulations, N = 100. The mutation rate μ takes values of 0.0001 (shaded circles), 0.0005 (crosses), 0.001 (solid diamonds), and 0.003 (open squares).

