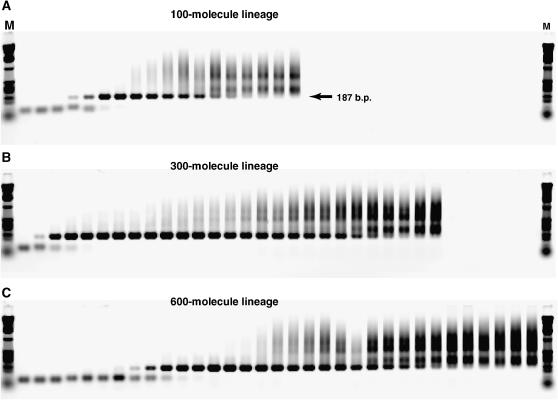
Figure 3.—
Tracking of lineage progress and death. Agarose gel electrophoretic images are of PCR amplifications of samples taken from consecutive bursts from three example lineages. (A) Bursts 1–18 of 100-molecule lineage 4V declared dead (i.e., complete loss of 187-bp band) at burst 18. (B) Bursts 1–27 of 300-molecule lineage 3J declared dead at burst 27. (C) Bursts 1–33 of 600-molecule lineage 3X declared dead at burst 37 (not shown on gel).

