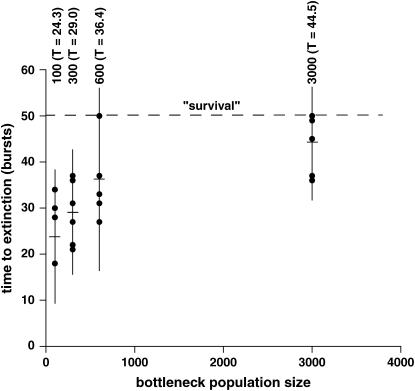
Figure 4.—
Mutational meltdown in RNA populations. Each dot represents a lineage, with the mean time to extinction (T) indicated by a crosshair in a vertical line spanning the mean ± 2 SD of trials for each of the four population sizes. Values of T are significantly different for the 100- vs. 600-, 100- vs. 3000-, and 300- vs. 3000-molecule comparisons (see text). The dashed line indicates the a priori designation of 50 bursts as being the threshold for a surviving lineage, at which point the lineages were discontinued.

