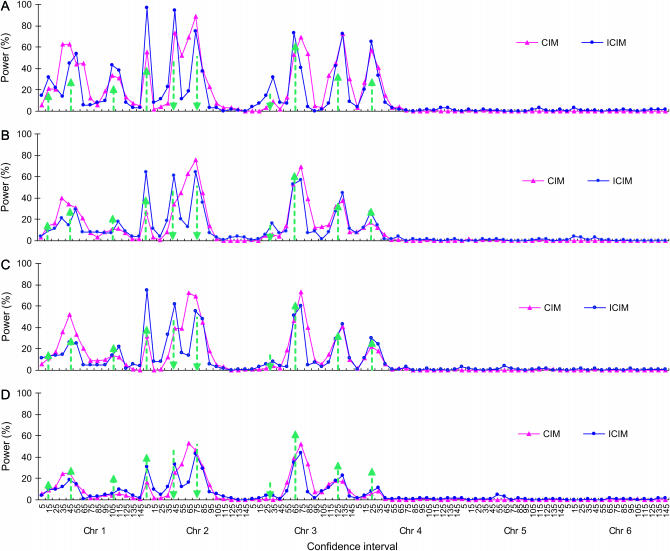
Figure 2.—
Power of QTL detection of CIM and ICIM for two genetic models and heritability levels under genome 1. Power was calculated as the proportion of runs that detected the presence of QTL for each of the 90 intervals defined by the 96 markers evenly distributed on six chromosomes. Arrow size and direction represent the approximate effect size and direction of the pointed QTL, respectively. (A) Additive genetic model, H = 0.8. (B) Additive genetic model, H = 0.5. (C) Additive and epistasis model, H = 0.8. (D) Additive and epistasis model, H = 0.5.

