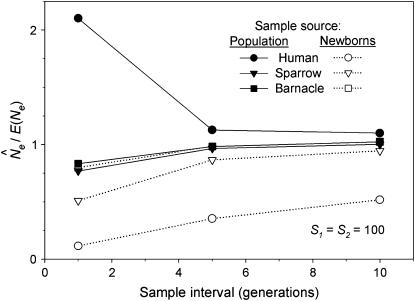
Figure 4.—
The ratio  for the three model species under constant population size and low N1. E(Ne) was computed using Equation 4 and the life-table data in Table 2.
  was calculated using
  in the standard temporal method, using random samples either from the population as a whole (Equation 8; solid symbols) or only from the cohort of newborns (Equation 11; open symbols). Sample sizes at times 1 and 2 were fixed at S1 = S2 = 100 but the interval between samples varied from L = 1 to 10 generations.

