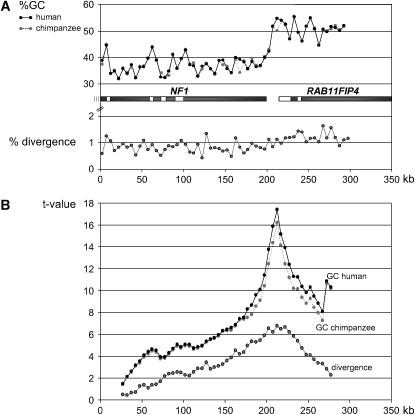
Figure 1.—
(A) GC-content curves for human (solid line) and chimpanzee (dotted line). Below these curves, the position of the NF1 gene (neurofibromatosis type 1) and the neighboring RAB11FIP4 gene (RAB11 family interacting protein 4) is indicated; the open sections represent the genomic regions that were resequenced in 29 human probands, chimpanzee, orangutan, and gorilla. The shaded curve shows the divergence between chimpanzee and human. Remarkable is the sharp GC-content transition in the intergenic region between NF1 and RAB11FIP4, which seems to coincide with a change in the rate of interspecies divergence. Almost all divergence values for the GC-poor region are <1%, whereas the values for the GC-rich region are >1%. (B) Statistical change-point analysis for the GC-content and divergence curves. The position where the t-test statistic takes its maximum value is a guess of a potential change point. The strongest change in both, the GC content and the interspecies divergence, could be assigned to nucleotide position 210–215 kb.

