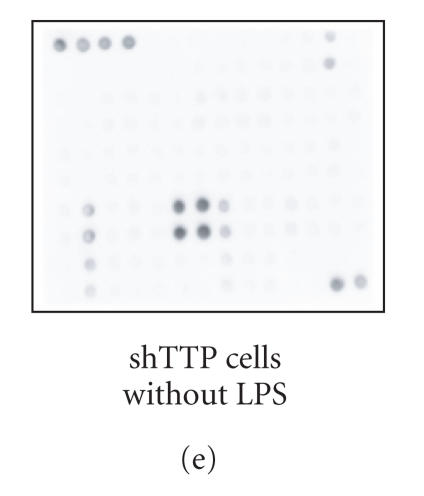
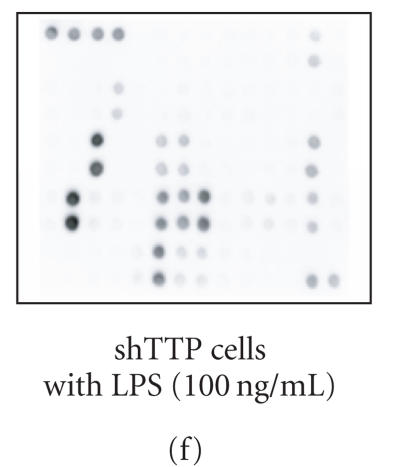
Figure 2.
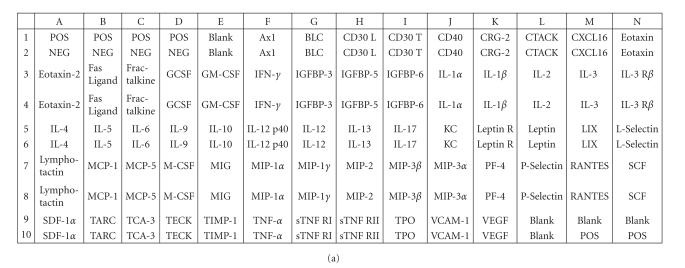
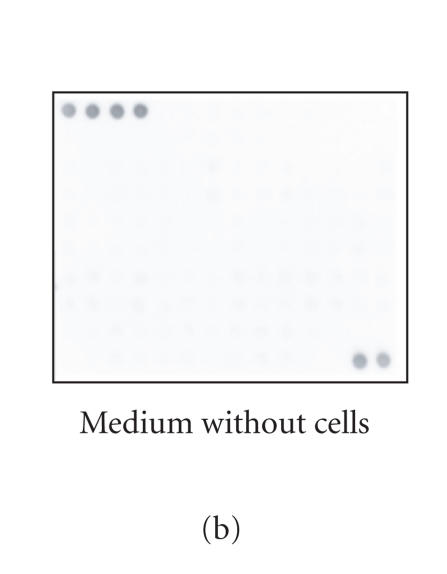
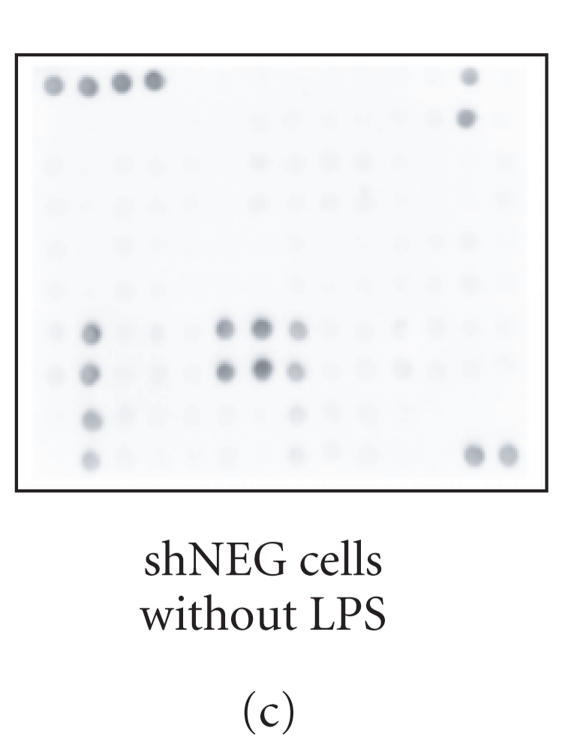
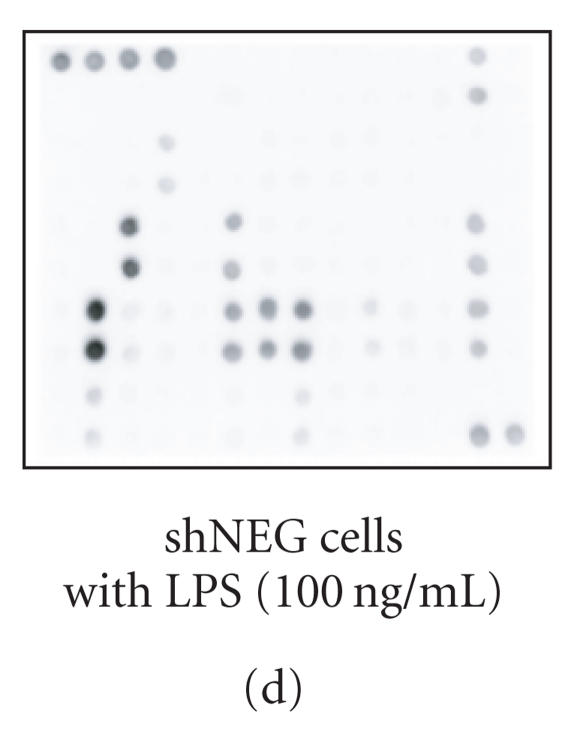
Cytokine antibody array. (a) A schematic diagram of the Mouse Cytokine Antibody Array III shows the locations of controls and the duplicate spots of cytokines. (b)–(f) Images of the membranes treated with cell culture media from the following experiments: (b) culture medium without cells, (c) shNEG cells, 49 h incubation, (d) shNEG cells, stimulated for 1 h with LPS (100 ng/mL) and incubated thereafter for 48 h, (e) shTTP cells, 49 h incubation, (f) shTTP cells, stimulated for 1 h with LPS (100 ng/mL) and incubated thereafter for 48 h. Representative membranes of three with similar results are shown. POS = positive control, NEG = negative control.

