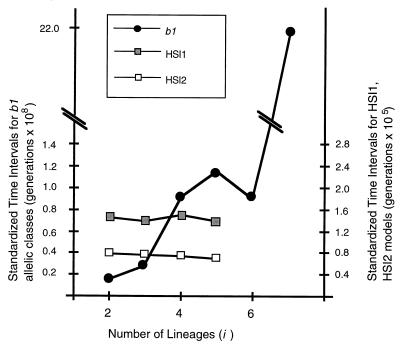
Figure 3.
Graphical analysis of standardized time intervals [T(i) × i × (i − 1)] expressed in generations and the number of lineages (i) present in the genealogy at each T(i). □ and ■, values for the numerical simulations with two haploid models, HSI1 and HSI2, respectively. ●, values for the b1 genealogy of Fig. 2.

