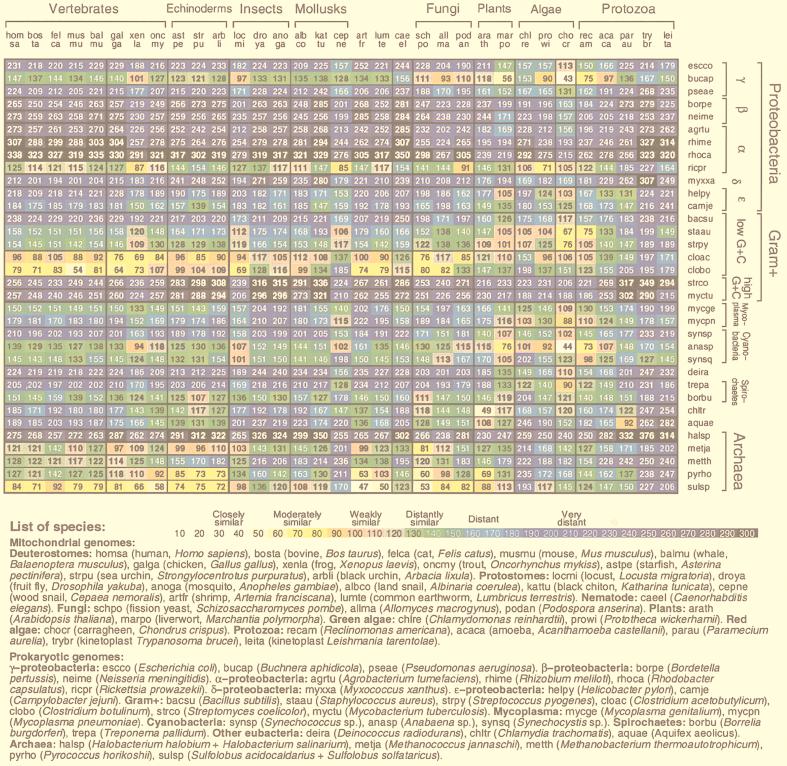
Figure 2.
Average δ* differences between prokaryotic and Mt DNA sequence samples based on comparisons of 50-kb samples. The complete genome was used for Mt sequences of less than 50 kb length. A representative collection of complete Mt genomes is compared to a representative set of prokaryotes, each with at least 100 kb of nonredundant DNA. See also Fig. 3 for 70 prokaryotes [published as supplemental data on the PNAS web site (www.pnas.org)].

