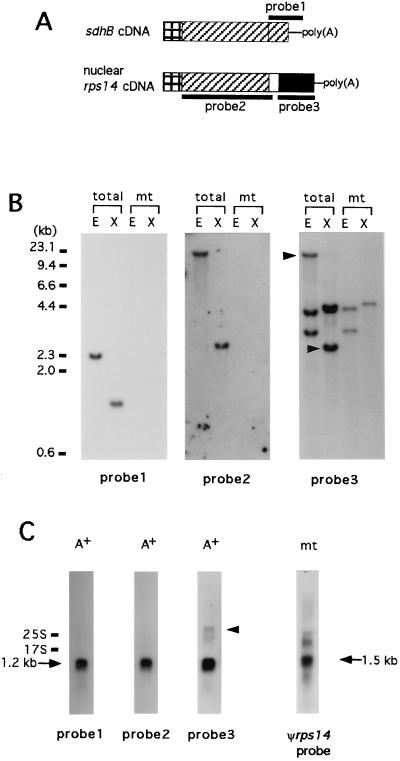
Figure 3.
DNA and RNA gel blot analyses of sdhB and nuclear rps14 genes in rice. (A) Schematic representation of sdhB and nuclear rps14 genes. The RPS14-homologous region is shown by a black box. sdhB-related regions are shown by hatched boxes. Thick lines indicate the DNA probes used for DNA and RNA gel blot analyses. (B) Rice total DNA (total) and mitochondrial DNA (mt) were digested with EcoRI (E) or XbaI (X). (Right; probe 3), the bands derived from nuclear DNA are indicated by arrowheads. A molecular length standard is shown at left. (C) Rice poly(A)+ RNA and mitochondrial RNA are represented by (A+) and (mt), respectively. The size of 25S and 17S ribosomal RNAs are indicated at left. The sizes of the transcripts are shown in the figure. A possible primary transcript is indicated by an arrowhead.

