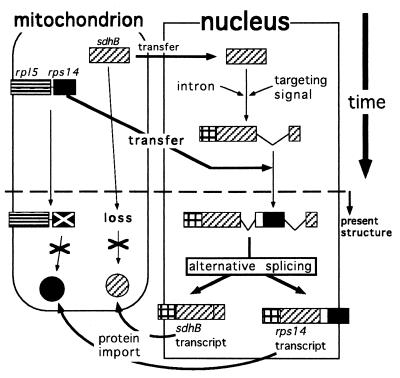
Figure 6.
Model for the gene transfer of sdhB and rps14. Rice nucleus and mitochondrion are shown by a square and an enclosure, respectively. Exons and introns are represented by boxes and broken lines, respectively. RPS14-homologous regions are shown by black boxes. sdhB-related regions are shown by hatched boxes. Black and hatched circles represent the products of rps14 and sdhB genes, respectively. Other symbols correspond to those in Fig. 4.

