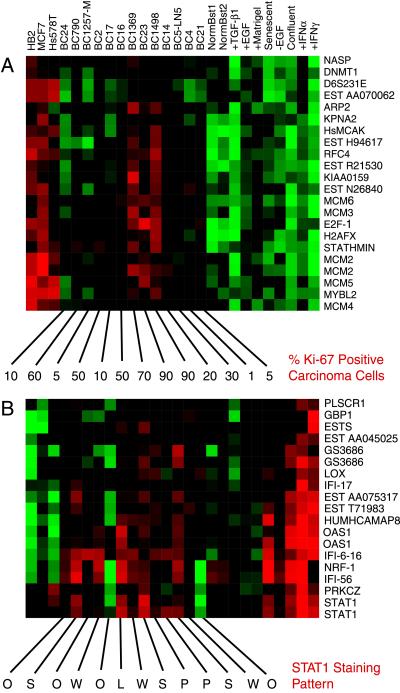
Figure 3.
Expanded view of two gene clusters taken from the 1,247-gene cluster diagram. (A) A portion of the proliferation-associated cluster. The numbers below each breast tumor’s column show the percentage of carcinoma cells in each specimen that stained positive for the Ki-67 antigen. (B) Expanded view of the IFN-regulated gene cluster. The letters below each breast tumor’s column identify the STAT1 staining pattern seen, with O representing no STAT1 staining (BC17 and Fig. 4A), W representing weak STAT1 staining, S representing strong staining (BC23 and Fig. 4C), P representing peripheral tumor cell nest staining (BC14 and Fig. 4E), and L representing staining of lymphocytes/histiocytes only (BC16 and Fig. 4G).

