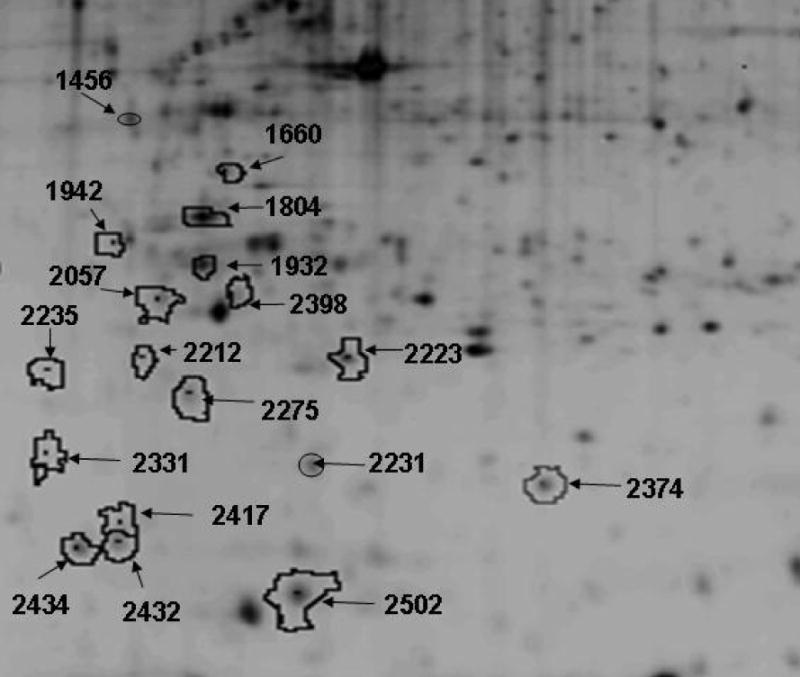
Fig. 3.

Two-dimensional analyses of heroin-induced differentially expressed proteins in NHA cells. Cells (1 x 10⁶ cells mL−1) were treated with 10−7M heroin for 24 hr. Total protein was isolated and subjected to DIGE analyses as described in methods, (n = 3). Data are shown as a representative 2D SYPRO-Ruby stained gel image of heroin treated NHA cells. Arrows represent differentially expressed proteins. The pH increases from left to right and the molecular mass decreases from the top to the bottom of the gels
