
Fig. 1.
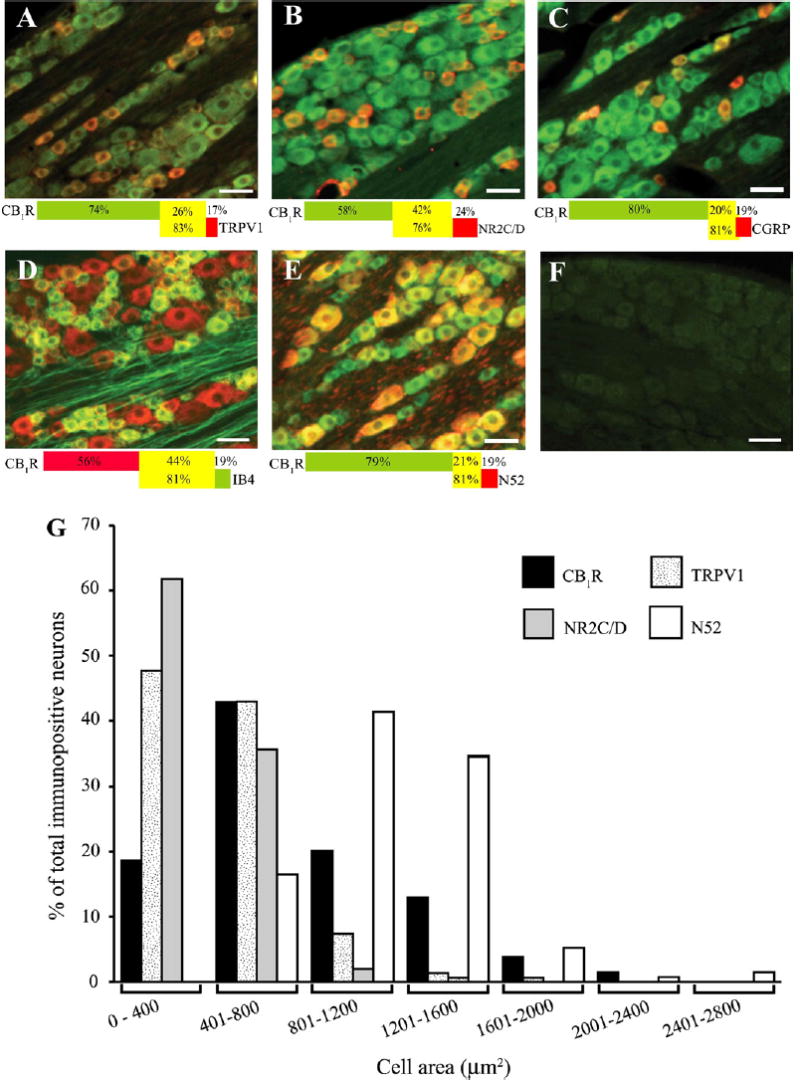
Co-localization of CB1R-ir with TRPV1 (A), NR2C/D (B), CGRP (C), IB4 (D) and N52 (E) in control rats. The CB1R-ir is green for all panels except panel D red. The co-markers are red for all the panels except panel D green. All panels are superimposed images of CB1R-ir and the co-markers, while co-labeling is yellow. The percentage of CB1R co-localization with the corresponding marker is illustrated by the colored bar corresponding to the CB1R and co-marker color. The percentage of CB1R-ir neurons co-labeled with marker is shown in the yellow area of top bar whereas the percentage of marker-positive neurons co-labeled with CB1R-ir is shown in the yellow area of bottom bar. All data were obtained from 3 sections/rat (n = 3 rats). Panel F shows the staining after pre-absorption with the CB1R blocking peptide (1 μg/ml). The scale bar = 50 μm throughout. Panel G shows the size distribution of CB1R-ir, TRPV1-ir, NR2C/D-ir and N52-ir cells in DRG. Note that CB1R-ir can be found throughout the range of cell sizes, whereas co-markers are seen predominantly in small-medium cells (<1200 μm2, TRPV1 and NR2C/D) or large cells (N52).